Planning Poker, T-Shirt Sizing, affinity mapping, or no estimates at all? A practical comparison of every estimation method used in sprint planning.
Why estimate at all?
Estimation in agile is not about predicting the future. As the Scrum Guide emphasizes, the purpose is to help the team plan its sprints, surface uncertainty, and have better conversations about upcoming work.
A good estimate answers the question: "How much can we realistically deliver in the next two weeks?" Without estimates, sprint planning becomes guesswork, and the team either over-commits (leading to burnout and incomplete sprints) or under-commits (wasting capacity).
The estimation methods compared
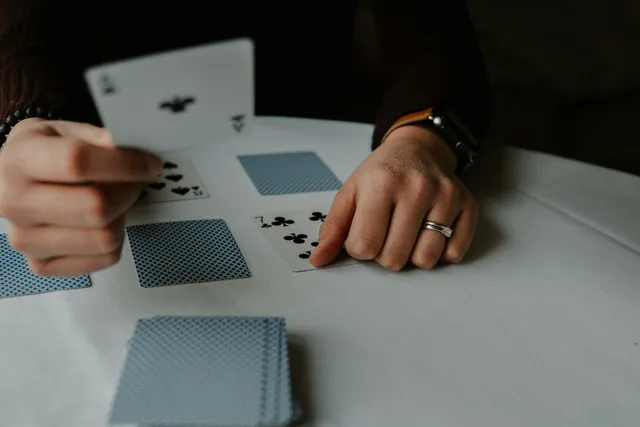
1. Planning Poker (Fibonacci)
The most popular technique in Scrum teams worldwide.
How it works: each team member simultaneously picks a card from the Fibonacci scale (1, 2, 3, 5, 8, 13, 21) representing their estimate of a story's relative effort. Cards are revealed at the same time. Divergences trigger discussion, then the team re-votes until reaching consensus.
Best for: sprint planning with 10-20 stories. Produces high-quality estimates through structured discussion.
Strengths:
- Eliminates anchoring bias through simultaneous reveal
- Forces discussion on divergent estimates, surfacing hidden complexity
- Fibonacci gaps reflect real-world uncertainty (see why Fibonacci works)
- Creates a shared understanding of each story across the team
Weaknesses:
- Takes 1-3 minutes per story
- Requires the full team to be present
- Diminishing returns beyond 20 stories per session
When to use: whenever you need reliable estimates for the stories entering the next sprint.
2. T-Shirt Sizing (XS to XXL)
A simpler, faster alternative that trades precision for speed.
How it works: the team classifies stories into size buckets: XS, S, M, L, XL, XXL. No numerical values, just relative categories.
Best for: roadmap planning, backlog grooming with 30+ stories, early-stage estimation when precision is not yet needed.
Strengths:
- Very fast (30 seconds per story)
- Intuitive for non-technical stakeholders
- Low cognitive load
- Good starting point before switching to Fibonacci for sprint-level precision
Weaknesses:
- Not precise enough for sprint capacity planning
- Hard to calculate velocity without numerical values
- Boundary between sizes is subjective
When to use: quarterly roadmap planning, initial backlog estimation, or when the team is new to agile.
Read our detailed T-Shirt Sizing guide and Fibonacci vs T-Shirt Sizing comparison.
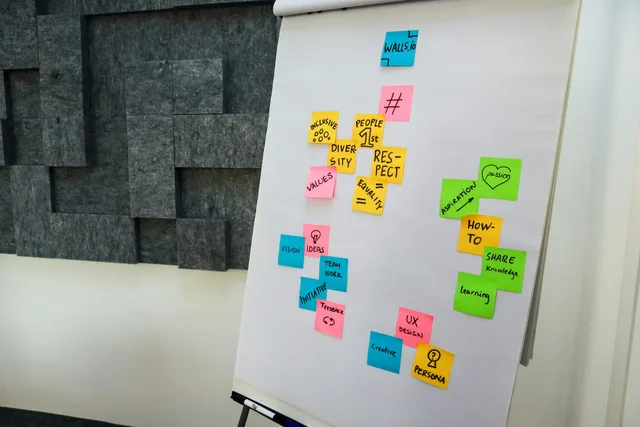
3. Affinity mapping (wall estimation)
A rapid technique for estimating large backlogs at once.
How it works: stories are printed on cards or sticky notes. The team silently places them on a wall or board from left (small) to right (large), arranging them relative to each other. Once all stories are placed, the team draws vertical lines to create buckets (1, 2, 3, 5, 8, 13...) and assigns values.
Best for: initial estimation of a brand-new backlog with 30-100 stories.
Strengths:
- Can estimate 50+ stories in under an hour
- Visual and collaborative
- Relative positioning is intuitive
- Good for forming a shared mental model of the backlog
Weaknesses:
- Requires physical presence (or a digital whiteboard like Miro)
- Less discussion per story than Planning Poker
- Estimates are rougher
When to use: project kickoffs, major backlog restructuring, or when the team inherits a large existing backlog.
4. Bucket system
A variant of affinity mapping designed for very large backlogs.
How it works: create "buckets" labeled with Fibonacci values (0, 1, 2, 3, 5, 8, 13, 20, 40, 100). Each team member takes stories from the pile and drops them into the bucket they think fits. After all stories are placed, the team reviews and discusses any stories in very high buckets or stories that were placed in different buckets by different people.
Best for: estimating 50-200 stories rapidly.
Strengths:
- Extremely fast for large volumes
- Can be done with distributed teams if using digital tools
- Scales well
Weaknesses:
- Less discussion per story
- Requires stories to be well-written and self-explanatory
- Rough estimates
When to use: large project discovery, portfolio-level estimation.
5. Dot voting
Not an estimation technique per se, but often confused with one.
How it works: each participant gets a fixed number of "dots" (votes) to distribute across stories. Stories with the most dots are considered highest priority.
Best for: prioritization, not complexity estimation.
Strengths:
- Simple and democratic
- Surfaces team priorities quickly
- Works well with non-technical stakeholders
Weaknesses:
- Measures perceived importance, not effort
- Cannot be used for capacity planning
- Groupthink risk (visible votes)
When to use: backlog prioritization workshops, feature voting sessions.
6. No estimates (#NoEstimates)
A movement that questions whether estimation adds value at all.
The argument: instead of estimating stories, break every story down to roughly the same size (1-2 days of work). Then count the number of stories completed per sprint. Velocity becomes "stories per sprint" instead of "points per sprint".
Best for: mature teams with consistent story sizes and stable velocity.
Strengths:
- Eliminates estimation overhead entirely
- Forces stories to be small and well-defined
- Simpler metrics
Weaknesses:
- Requires discipline in story splitting
- Hard to apply to stories with variable complexity
- Does not surface hidden complexity the way Planning Poker does
- Less applicable when communicating with stakeholders who expect timeline forecasts
When to use: only when the team has mastered consistent story splitting and has a stable delivery cadence.
Comparison matrix
| Method | Speed | Precision | Team size | Best backlog size | Discussion quality |
|---|---|---|---|---|---|
| Planning Poker | Medium | High | 3-9 | 10-20 stories | Excellent |
| T-Shirt Sizing | Fast | Low | Any | 20-50 stories | Low |
| Affinity Mapping | Fast | Medium | 3-12 | 30-100 stories | Medium |
| Bucket System | Very fast | Low-Medium | Any | 50-200 stories | Low |
| Dot Voting | Fast | N/A (priority) | Any | 10-30 stories | Low |
| #NoEstimates | N/A | N/A | Small | Any | None (by design) |
Choosing the right technique
Use this decision tree:
- Do you need precise estimates for the next sprint? Use Planning Poker.
- Do you need rough sizing for a roadmap? Use T-Shirt Sizing.
- Do you have a large new backlog to estimate? Use Affinity Mapping or Bucket System first, then refine with Planning Poker for the top items.
- Do you just need to prioritize? Use Dot Voting.
- Does your team consistently deliver small, uniform stories? Consider #NoEstimates.
Most teams use a combination: T-Shirt Sizing for the roadmap, Planning Poker for sprint planning, and occasional Affinity Mapping for backlog restructuring.
What makes an estimate "good"?
A good estimate is not an accurate prediction. It is a catalyst for better conversations. An estimate is "good" when:
- The team agrees on what the story involves (shared understanding)
- Hidden complexity has been surfaced (risk reduction)
- The team can plan a realistic sprint (capacity management)
- Stakeholders can forecast delivery timelines (expectation management)
The number on the card matters less than the conversation that produced it.
Common pitfalls across all methods
Confusing effort with duration. Story points measure relative complexity, not calendar time. A 5-point story is not "5 days."
Comparing velocity across teams. Team A's "5" and Team B's "5" are not the same. Velocity is a team-internal metric, not a cross-team benchmark.
Estimating too early. Estimating stories that are vague or months away from implementation is waste. Estimate when the story is refined and approaching the sprint.
Ignoring the "?" card. When someone signals they cannot estimate, the story needs more information. Do not force a number.
Re-estimating completed stories. Once a story is done, its estimate is historical data. Do not retroactively change it to match actuals. Use the discrepancy to improve future estimates.
Start estimating with your team
Ready to try the most popular estimation technique? Create a free Planning Poker session and estimate your next sprint in minutes. No sign-up, no setup, just share a link.